
Date | Analyst | Company | Last | Target | Call | Valuation |
01/05/22 | SAC Capital | Marco Polo | 0.028 | 0.032 | Buy | PER8x FY22 |
03/25/22 | DMG & Partners | Marco Polo | 0.029 | 0.04 | Buy | |
06/03/22 | DMG & Partners | Marco Polo | 0.03 | 0.04 | Buy | DCF |
06/17/22 | UOB Kay Hian | Marco Polo | 0.028 | 0.043 | Buy | PB1.1x FY22 |
08/30/22 | DMG & Partners | Marco Polo | 0.037 | 0.05 | Buy | DCF |
12/07/22 | UOB Kay Hian | Marco Polo | 0.047 | 0.048 | Hold | PB1.1x FY23 |
03/30/23 | DMG & Partners | Marco Polo | 0.043 | 0.06 | Buy | DCF |
Wednesday, May 3, 2023
Marco Polo - Stock calls
Mapletree North Asia - Stock calls
Date | Analyst | Company | Last | Target | Call | Valuation |
01/03/22 | Lim & Tan | Mapletree North Asia | 1.11 | 0 | Accept Offer | |
01/06/22 | CIMB | Mapletree North Asia | 1.09 | 1.13 | Add | DDM |
01/06/22 | OCBC | Mapletree North Asia | 1.09 | 1.15 | Hold | |
03/21/22 | Lim & Tan | Mapletree North Asia | 1.12 | 0 | Accept Offer | |
04/20/22 | Lim & Tan | Mapletree North Asia | 1.23 | 0 | Accept Offer | |
04/21/22 | CIMB | Mapletree North Asia | 1.23 | 1.13 | Hold | |
04/21/22 | Citi Research | Mapletree North Asia | 1.23 | 1.2 | Hold |
Stock calls for 2 May 2023
Date | Analyst | Company | Last | Target | Call | Valuation |
05/02/23 | DBS Vickers | AEM | 3.38 | 3.35 | Hold | PER10x FY24 |
05/02/23 | Uob Kay Hian | Capitaland Integrated Commercial Trust | 2.03 | 2.29 | Buy | DDM |
05/02/23 | OCBC | Capitaland Integrated Commercial Trust | 2.03 | 2.21 | Buy | |
05/02/23 | DMG & Partners | Capitaland Integrated Commercial Trust | 2.03 | 2 | Neutral | DDM |
05/02/23 | UOB Kay Hian | CDL Hospitality | 1.26 | 1.55 | Buy | DDM |
05/02/23 | Citi Research | CDL Hospitality | 1.26 | 1.15 | Sell | DDM |
05/02/23 | Kim Eng | Far East Hospitality | 0.62 | 0.8 | Buy | |
05/02/23 | CIMB | Mapletree Commercial | 1.76 | 1.9 | Hold | |
05/02/23 | UOB Kay Hian | Mapletree Industrial | 2.38 | 2.82 | Buy | DDM |
05/02/23 | OCBC | Mapletree Industrial | 2.38 | 2.77 | Buy | |
05/02/23 | Lim & Tan | Mapletree Logistics | 1.74 | 1.8 | Neutral | |
05/02/23 | DBS Vickers | Micro-Mechanics | 2.1 | 1.75 | Fully Valued | PER21x FY23/24 |
05/02/23 | DMG & Partners | Sheng Siong | 1.77 | 2 | Buy | PER21x FY23 |
05/02/23 | phillip | UOB | 28.22 | 35.7 | Buy | GGM, PB1.48x FY23 |
05/02/23 | UOB Kay Hian | Wilmar | 3.93 | 5.5 | Buy | Sum of parts |
Tuesday, May 2, 2023
The US ISM PMI has been contracting for 6 months.


The prices subindex had increased to 53.2 (+4) because it was affected by an uprise in employment subindex (50.2, +3.3). The employment increased as the producers boosted its production (48.9, +1.1) to fulfil the increase in customers’ inventories (51.3, +2.4) which was caused by an increase in new orders (45.7, +1.4) from new export order (49.8, +2.2). However, the new local order was declined (Est'd -0.8) as consumers cut back on their spendings because of the high inflation.
The backlog of order fell to 43.1 (-0.8) because the increase in customers’ inventories exceeded the new order. The supplier’s delivery (44.6, -0.2) continued to improve due to an easing in supply and logistical issues. A lower delivery index means a faster delivery period. The inventories (46.3, -1.2) were depleted by the production boost and the producers used more imported material (49.9, +2) than local raw material (Est’d -3.2).
In conclusion, the above factors caused the PMI to increase marginally to 47.1 (+0.8) but the economy would still enter into a recession in 2023 as the PMI had been contracting (below 50) for 6 months already.
What will the FED do for its FOMC in May 2023?
Let's take a look at the Fedwatch tool result. The Fedwatch tool is indicating that the Fed will increase its rate by 25bp with over 90% probability in May 2023.

Sunday, April 30, 2023
Latest US economic statistics for the 4th week of April 2023.
All the recent US economic statistics are pointing to an impending recession. Why? Let's take a look and do a brief analysis.
US recession probability: It has been rising. What's the validity of this probability?
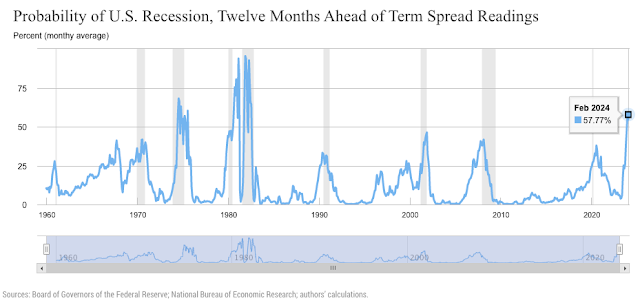
The truck tonnage index corroborates the rising recession probability and the declining LEI because it trucking tonnages have been declining. This means the main street demand is falling as consumers are cutting back on their spendings.

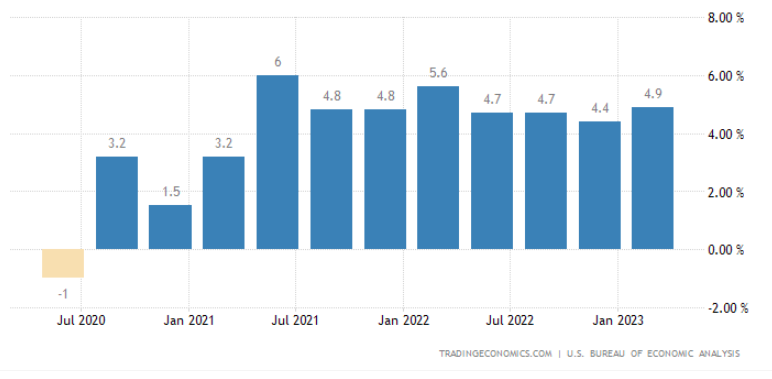
Why are US consumers cutting back their spendings? Let's take a look at the PCE inflation index.
 Core PCE index: 4.6%
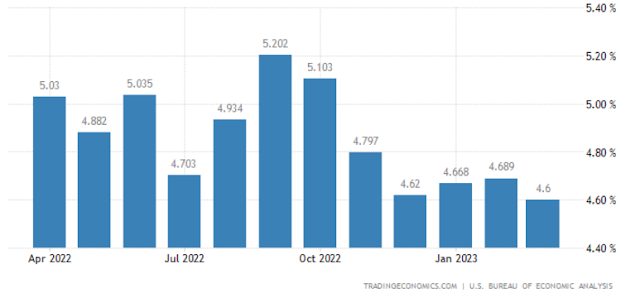 Both the PCE and Core PCE indexes have stayed above 4% for a long time and the US consumers are affected by the sky-high inflation because their savings have been depleted.
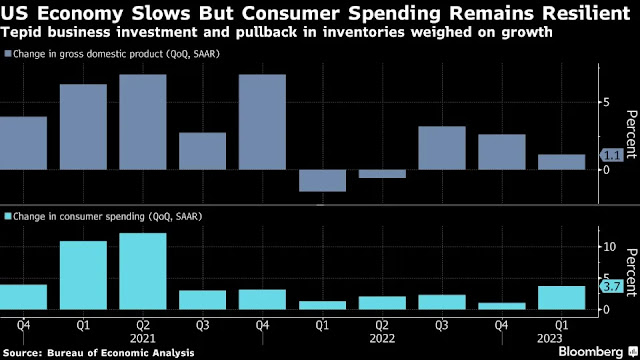 The Q1 GDP growth of 1.1% was being supported by consumption but it was the peak already because consumers' savings were depleted by the high inflation. The US consumption will start to fall in Q2.
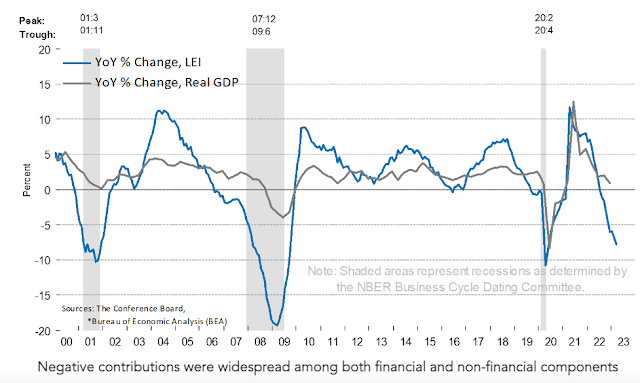
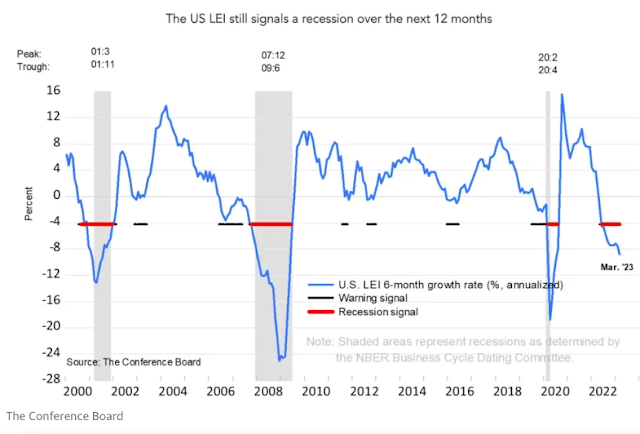
US Leading economic indicator (LEI): It has been trending down.

The US LEI has been giving out a recession signal since 2022.


PCE index: 4.9%

The latest GDP figure, being a lagging indicator, has started to reflect the reality of the main street activities.
Q1 GDP growth: 1.1%

Let's break the GDP growth down and we can see the true reality.
GDP growth = G + I + C + Net export (X-M)
GDP growth = 0.81 + (-2.34) + 2.48 + 0.11 = 1.06% (rounded up to 1.1%)
As we could see from the breakdown, the investment (-2.34) dropped significantly because of a sharp drop in business inventories. The consumption (+2.48) was holding up the GDP growth but it had reached its peak and was no longer sustainable. The US government spending (0.81) won't be able to increase much further in Q2 because of its debt ceiling. If the US can't increase its net export, the Q2 GDP figure won't be better than Q1.
Subscribe to:
Posts (Atom)


.jpg)