Date | Analyst | Company | Last | Target | Call | Valuation |
01/05/22 | SAC Capital | Marco Polo | 0.028 | 0.032 | Buy | PER8x FY22 |
03/25/22 | DMG & Partners | Marco Polo | 0.029 | 0.04 | Buy | |
06/03/22 | DMG & Partners | Marco Polo | 0.03 | 0.04 | Buy | DCF |
06/17/22 | UOB Kay Hian | Marco Polo | 0.028 | 0.043 | Buy | PB1.1x FY22 |
08/30/22 | DMG & Partners | Marco Polo | 0.037 | 0.05 | Buy | DCF |
12/07/22 | UOB Kay Hian | Marco Polo | 0.047 | 0.048 | Hold | PB1.1x FY23 |
03/30/23 | DMG & Partners | Marco Polo | 0.043 | 0.06 | Buy | DCF |
Wednesday, May 3, 2023
Marco Polo - Stock calls
Mapletree North Asia - Stock calls
Date | Analyst | Company | Last | Target | Call | Valuation |
01/03/22 | Lim & Tan | Mapletree North Asia | 1.11 | 0 | Accept Offer | |
01/06/22 | CIMB | Mapletree North Asia | 1.09 | 1.13 | Add | DDM |
01/06/22 | OCBC | Mapletree North Asia | 1.09 | 1.15 | Hold | |
03/21/22 | Lim & Tan | Mapletree North Asia | 1.12 | 0 | Accept Offer | |
04/20/22 | Lim & Tan | Mapletree North Asia | 1.23 | 0 | Accept Offer | |
04/21/22 | CIMB | Mapletree North Asia | 1.23 | 1.13 | Hold | |
04/21/22 | Citi Research | Mapletree North Asia | 1.23 | 1.2 | Hold |
Stock calls for 2 May 2023
Date | Analyst | Company | Last | Target | Call | Valuation |
05/02/23 | DBS Vickers | AEM | 3.38 | 3.35 | Hold | PER10x FY24 |
05/02/23 | Uob Kay Hian | Capitaland Integrated Commercial Trust | 2.03 | 2.29 | Buy | DDM |
05/02/23 | OCBC | Capitaland Integrated Commercial Trust | 2.03 | 2.21 | Buy | |
05/02/23 | DMG & Partners | Capitaland Integrated Commercial Trust | 2.03 | 2 | Neutral | DDM |
05/02/23 | UOB Kay Hian | CDL Hospitality | 1.26 | 1.55 | Buy | DDM |
05/02/23 | Citi Research | CDL Hospitality | 1.26 | 1.15 | Sell | DDM |
05/02/23 | Kim Eng | Far East Hospitality | 0.62 | 0.8 | Buy | |
05/02/23 | CIMB | Mapletree Commercial | 1.76 | 1.9 | Hold | |
05/02/23 | UOB Kay Hian | Mapletree Industrial | 2.38 | 2.82 | Buy | DDM |
05/02/23 | OCBC | Mapletree Industrial | 2.38 | 2.77 | Buy | |
05/02/23 | Lim & Tan | Mapletree Logistics | 1.74 | 1.8 | Neutral | |
05/02/23 | DBS Vickers | Micro-Mechanics | 2.1 | 1.75 | Fully Valued | PER21x FY23/24 |
05/02/23 | DMG & Partners | Sheng Siong | 1.77 | 2 | Buy | PER21x FY23 |
05/02/23 | phillip | UOB | 28.22 | 35.7 | Buy | GGM, PB1.48x FY23 |
05/02/23 | UOB Kay Hian | Wilmar | 3.93 | 5.5 | Buy | Sum of parts |
Tuesday, May 2, 2023
The US ISM PMI has been contracting for 6 months.
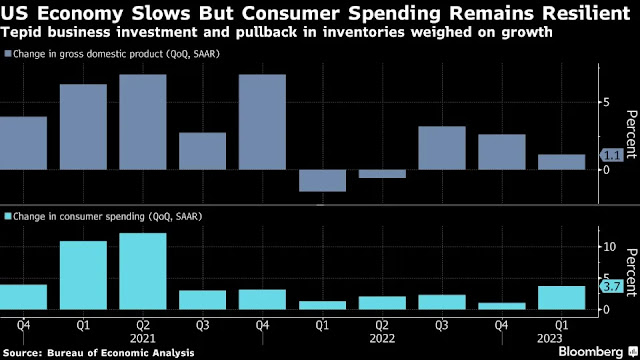
The prices subindex had increased to 53.2 (+4) because it was affected by an uprise in employment subindex (50.2, +3.3). The employment increased as the producers boosted its production (48.9, +1.1) to fulfil the increase in customers’ inventories (51.3, +2.4) which was caused by an increase in new orders (45.7, +1.4) from new export order (49.8, +2.2). However, the new local order was declined (Est'd -0.8) as consumers cut back on their spendings because of the high inflation.
The backlog of order fell to 43.1 (-0.8) because the increase in customers’ inventories exceeded the new order. The supplier’s delivery (44.6, -0.2) continued to improve due to an easing in supply and logistical issues. A lower delivery index means a faster delivery period. The inventories (46.3, -1.2) were depleted by the production boost and the producers used more imported material (49.9, +2) than local raw material (Est’d -3.2).
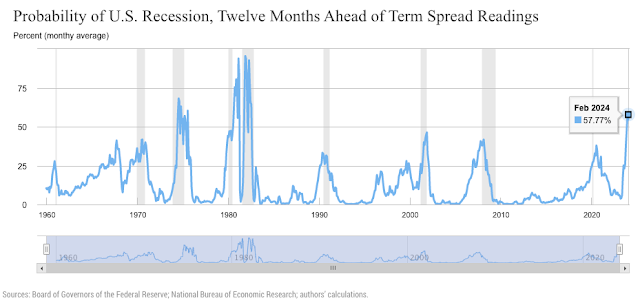
In conclusion, the above factors caused the PMI to increase marginally to 47.1 (+0.8) but the economy would still enter into a recession in 2023 as the PMI had been contracting (below 50) for 6 months already.


